Tracing Trees: Visualizing Variability in the Architecture of Random Forest Trees Using Extensions of Trace Plots
Talk for ISU Graphics Group.
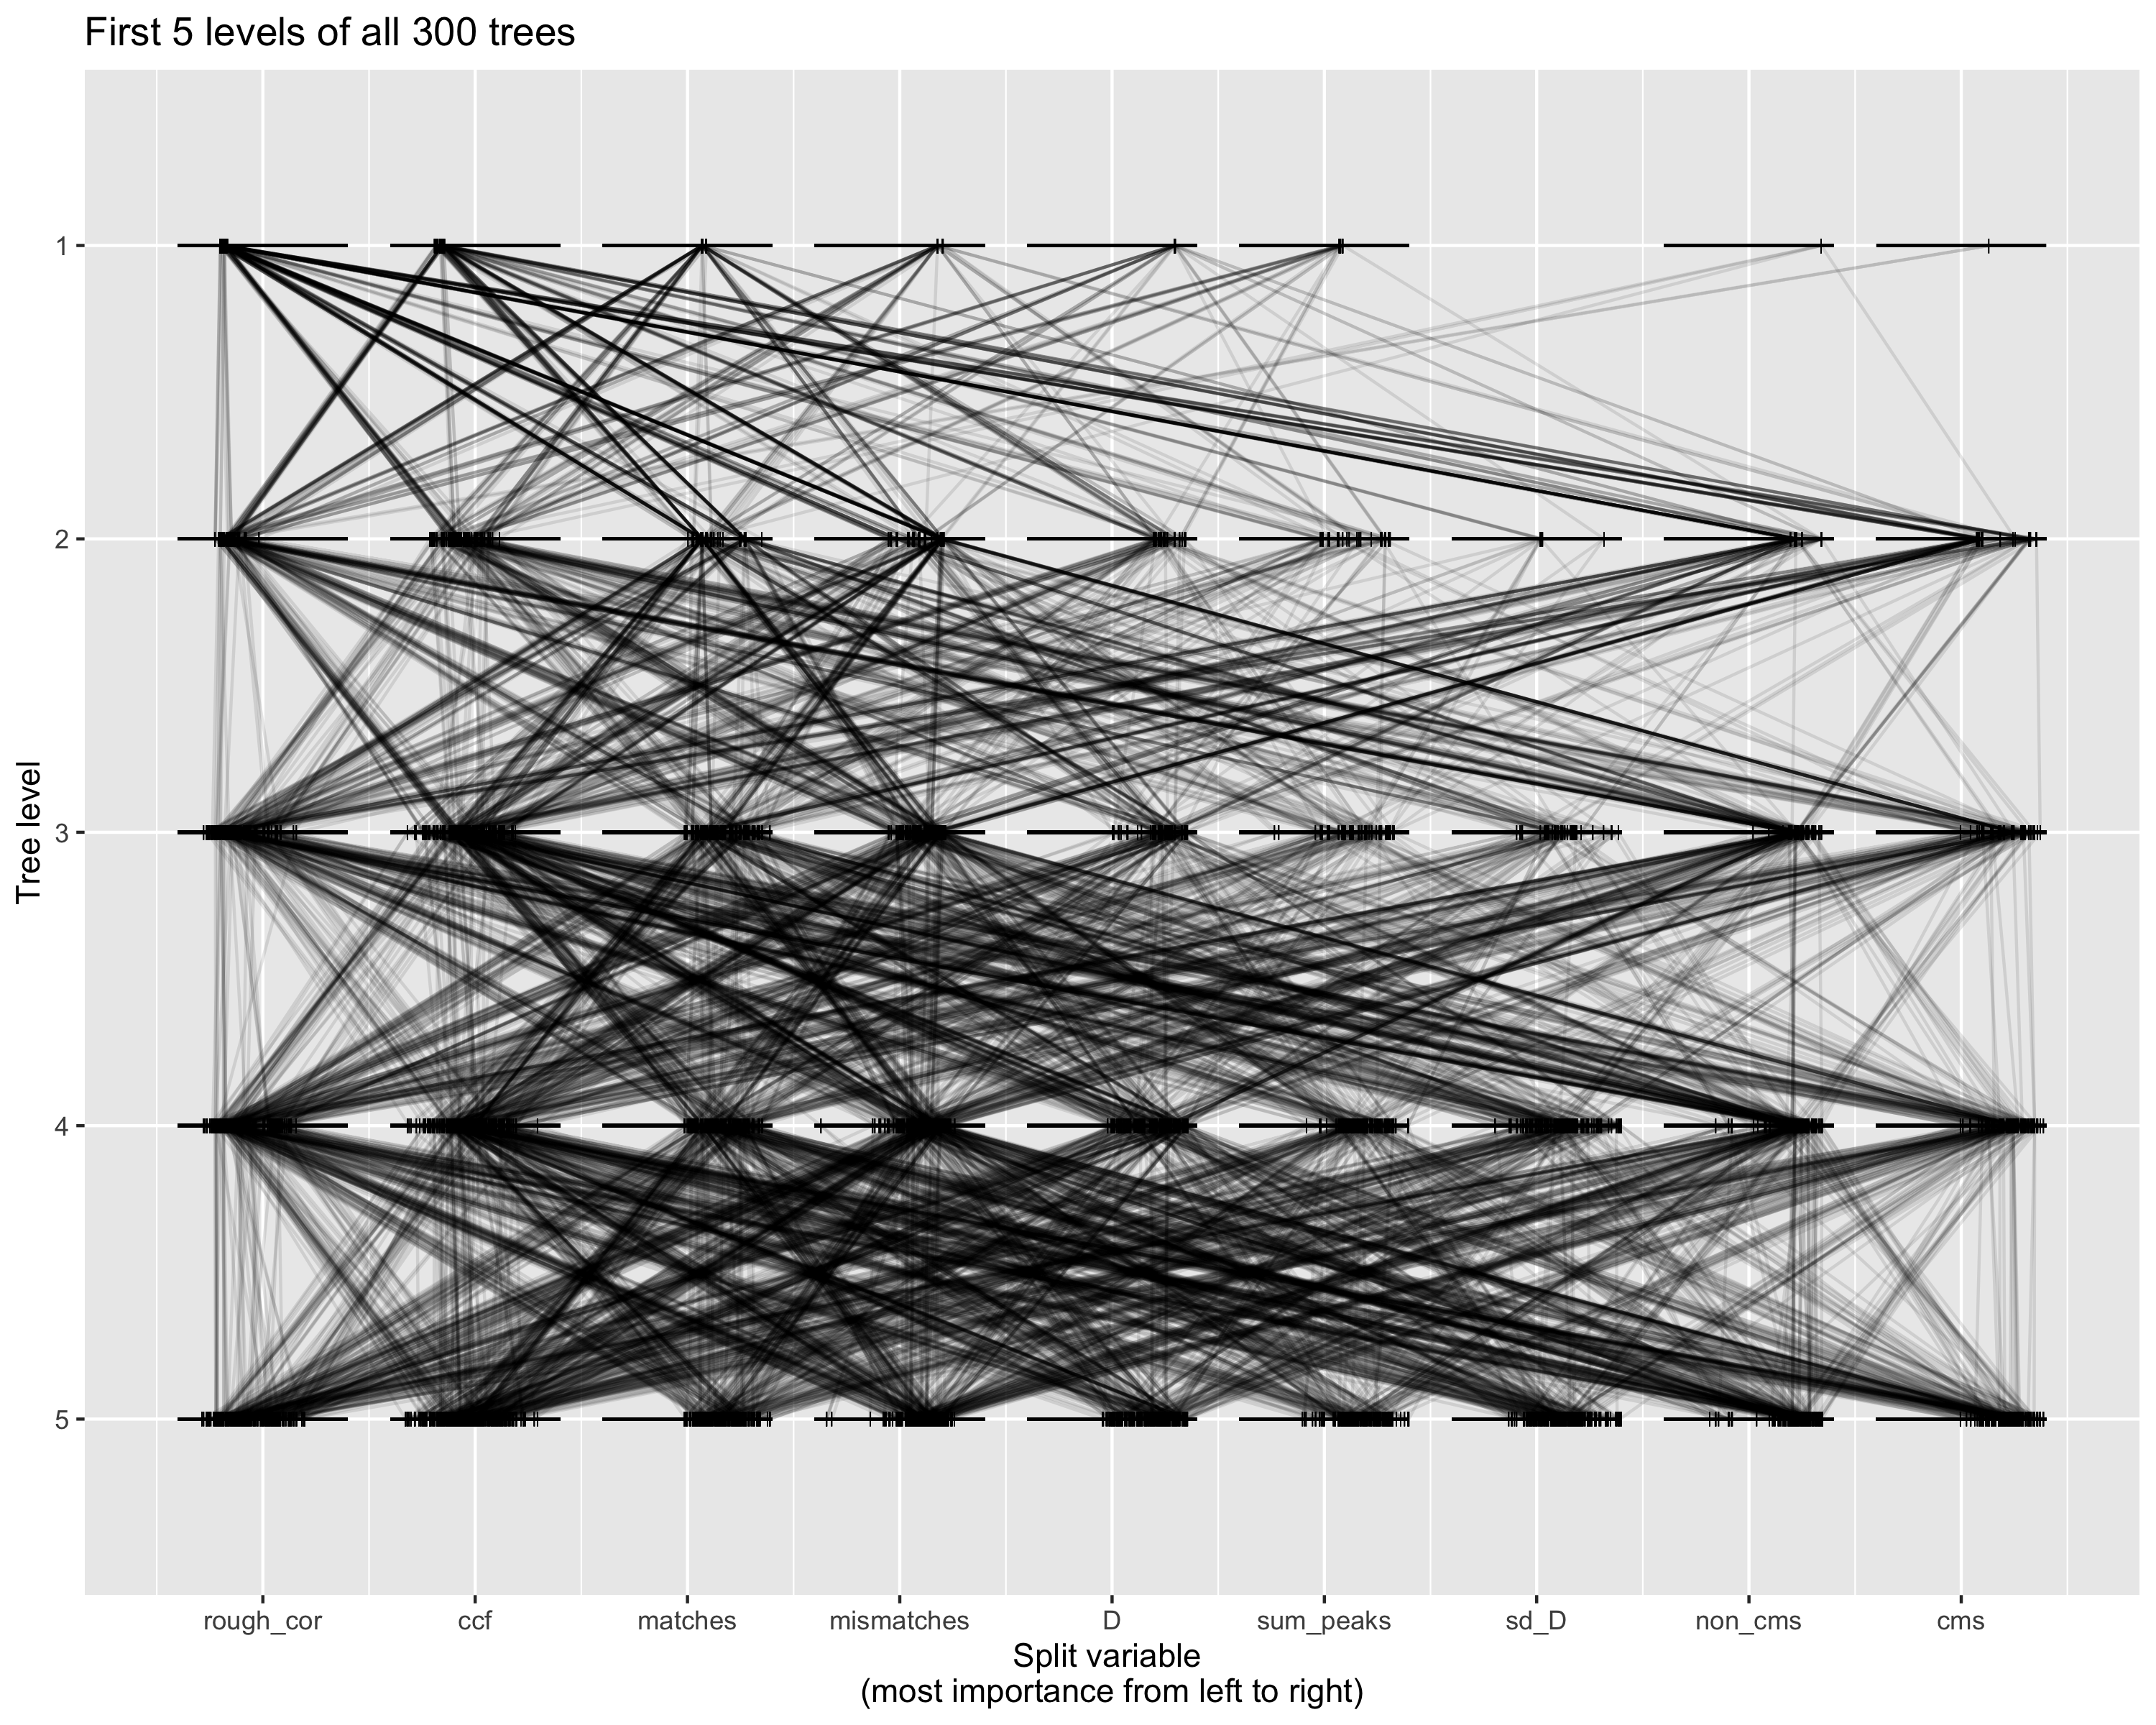
Random forests are a popular method for statistical applications with an objective of prediction. While an individual tree within a random forest provides a clear decision path for how a prediction is made, the ensemble of trees from the forest creates a complex decision process that is difficult to interpret. One approach used to gain insight into this decision process is visualization of the model. Various approaches have been taken to visualize random forests including trace plots developed by Simon Urbanek (https://link.springer.com/chapter/10.1007/978-3-540-33037-0_11). Trace plots depict the trees in a random forest using a structure similar to parallel coordinate plots that allows for a direct comparison of the trees. In this talk, I’ll describe trace plots and discuss my recent work on implementing and extending trace plots in R. I’ll also discuss my attempts to use trace plots to compare variability between clusters of trees in a random forest and visualizing representative or summary trees in the context of tree variability.