Panel of Diagnostic Residual Plots.
resid_auxpanel.RdCreates a panel of residual diagnostic plots given inputs of residuals and fitted values.
resid_auxpanel(
  residuals,
  predicted,
  plots = "default",
  bins = 30,
  smoother = FALSE,
  qqline = TRUE,
  qqbands = FALSE,
  scale = 1,
  theme = "bw",
  axis.text.size = 10,
  title.text.size = 12,
  title.opt = TRUE,
  nrow = NULL
)
Arguments
- residuals
The residuals from the model.
- predicted
The fitted values from the model.
- plots
Plots chosen to include in the panel of plots. The default panel includes a residual plot, a normal quantile plot, an index plot, and a histogram of the residuals. (See details for the options available.)
- bins
Number of bins for histogram of the residuals. Default is set to 30.
- smoother
Indicates whether or not to include a smoother on the residual plot and/or index plot. Specify TRUE or FALSE. Default is set to FALSE.
- qqline
Indicates whether to include a 1-1 line on the qq-plot. Specify TRUE or FALSE. Default is set to TRUE.
- qqbands
Indicates whether to include confidence bands on the qq-plot. Specify TRUE or FALSE. Default is set to FALSE.
- scale
Scales the size of the graphs in a panel. Takes values in (0,1].
- theme
ggplot2 theme to be used. Options are
"bw","classic", and"grey"(or"gray"). Default is"bw".- axis.text.size
Specifies the size of the text for the axis labels of all plots.
- title.text.size
Specifies the size of the text for the titles of all plots.
- title.opt
Indicates whether or not to include a title on the plots. Specify TRUE or FALSE. Default is set to TRUE.
- nrow
Sets the number of rows in the panel.
Value
A panel of residual diagnostic plots containing plots specified.
Details
The following grid options can be chosen for the plots
argument.
"all": This creates a panel of all plot types included in the package that are available for
resid_auxpanel. (See plot descriptions under individual options.)"default": This creates a panel with a residual plot, a normal quantile plot of the residuals, an index plot of the residuals, and a histogram of the residuals.
"SAS": This creates a panel of a residual plot, a normal quantile plot of the residuals, a histogram of the residuals, and a boxplot of the residuals. This was modeled after the residpanel option in proc mixed from SAS version 9.4.
A vector of individual plots can also be specified. For example, one can specify
plots = c("boxplot", "hist")orplots = "qq". The individual plot options are as follows."boxplot": A boxplot of residuals"hist": A histogram of residuals"index": A plot of residuals versus observation number"qq": A normal quantile plot of residuals"resid": A plot of residuals versus predicted values
Details on the creation of the plots can be found in the details section of
the help file for resid_panel.
Examples
# Fit a regression tree to the penguins data
penguin_tree <- rpart::rpart(heartrate ~ depth + duration, data = penguins)
# Obtain the predictions from the model on the observed data
penguin_tree_pred <- predict(penguin_tree)
# Obtain the residuals from the model
penguin_tree_resid <- penguins$heartrate - penguin_tree_pred
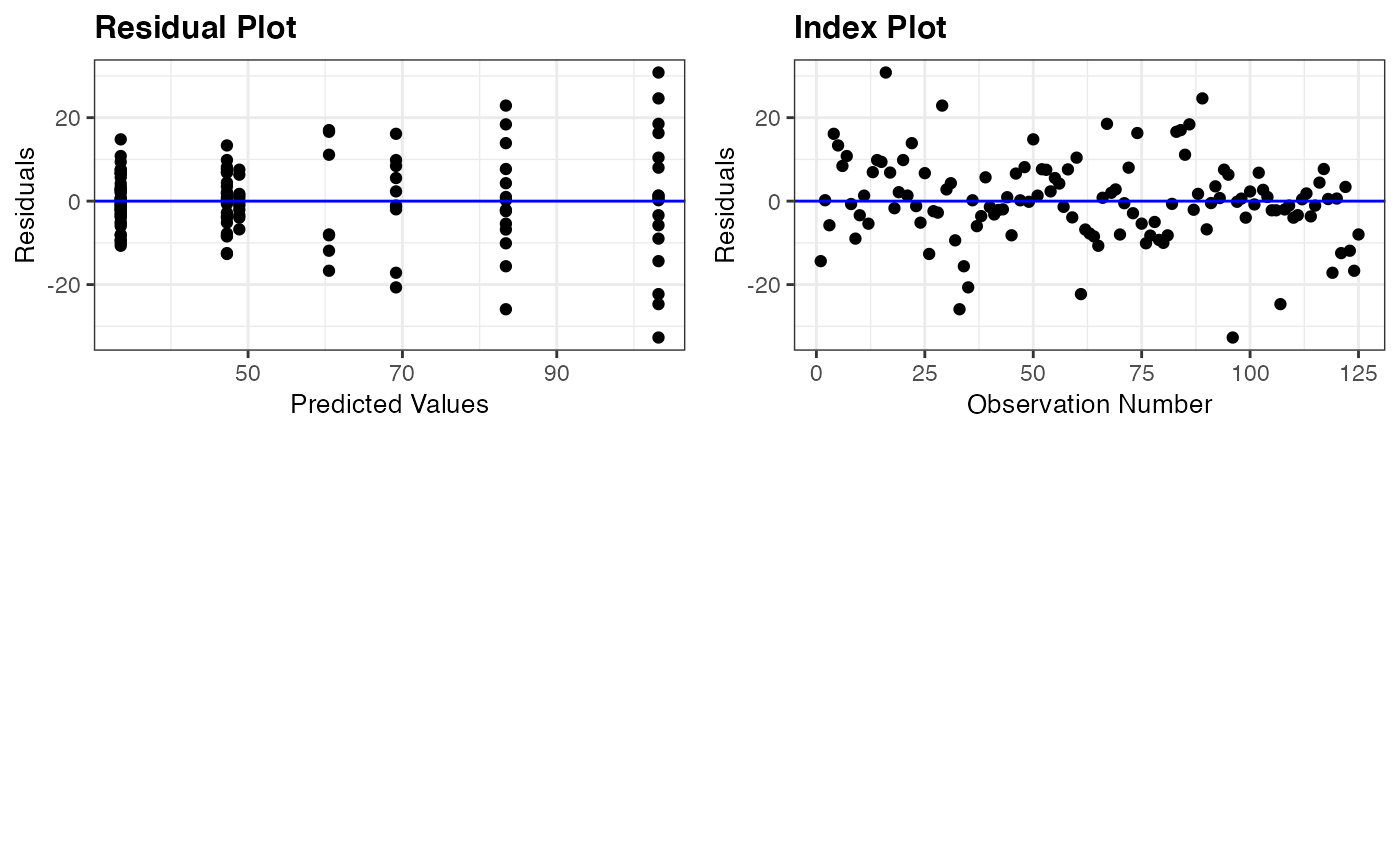
# Create a panel with the residual and index plot
resid_auxpanel(residuals = penguin_tree_resid,
predicted = penguin_tree_pred,
plots = c("resid", "index", "yvp"))