Introducing ggResidpanel: An R Package for Easy Visualization of Residuals
Poster for Kansas State University Conference on Applied Statistics in Agriculture presented with Katie Rey
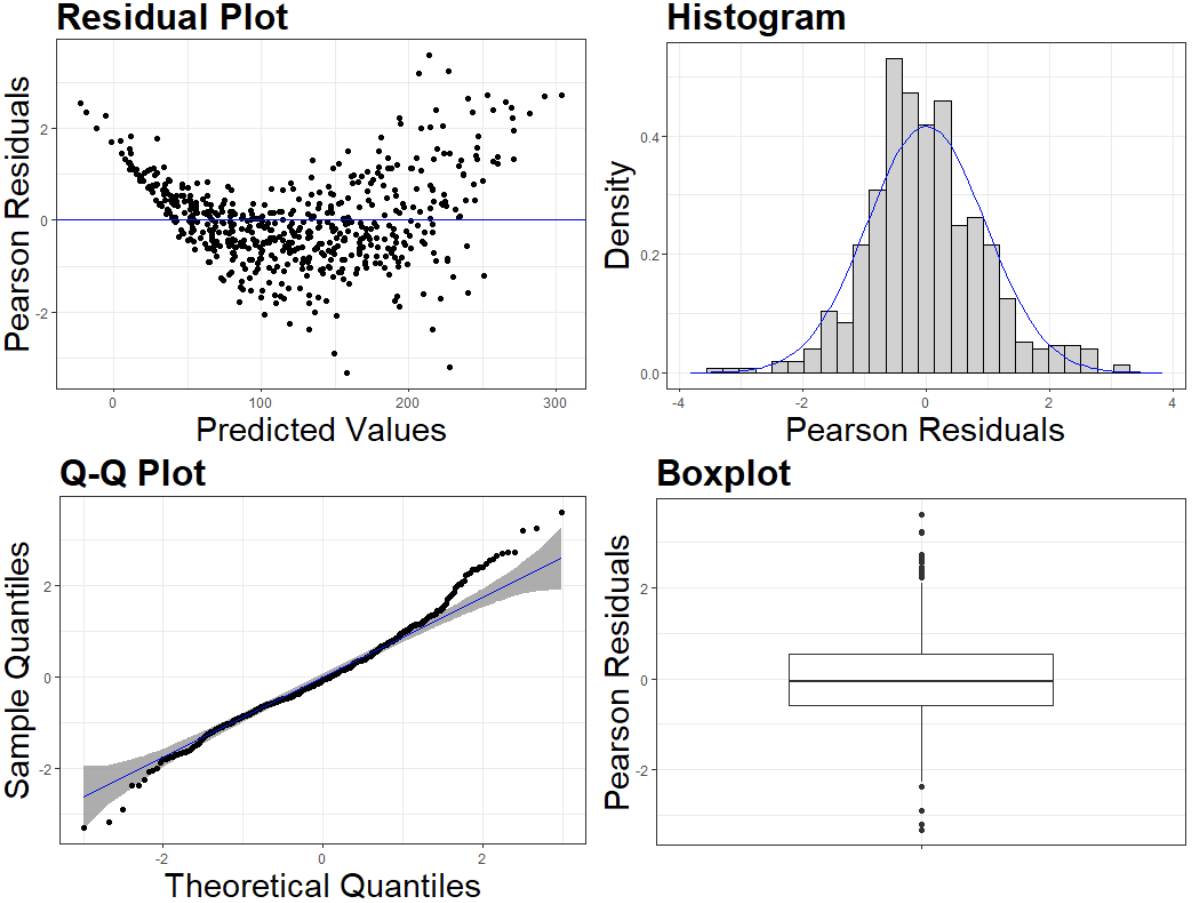
As consultants on a wide variety of projects across many majors, a common oversight we encounter is a failure to examine the residuals. This is particularly true when the client is performing the analysis in R. We were inspired by the residual panel in SAS to create an R package that easily provides users with a similar panel of plots. The ggResidpanel package in R is intended to give a single view of diagnostic plots for checking the key underlying assumptions of linear models. A variety of options gives the user the ability to choose from a selection of plots to display in a window. This includes SAS’s default residual panel as well as R’s default plots for linear models. Other options have been included to ensure that this package can also be applied to deviance or Pearson residuals if the user inputs a generalized linear model. Cook’s D plots and interactive plots using Plotly are included to provide a straightforward process to identify outliers and influential points while connecting findings back to the data.