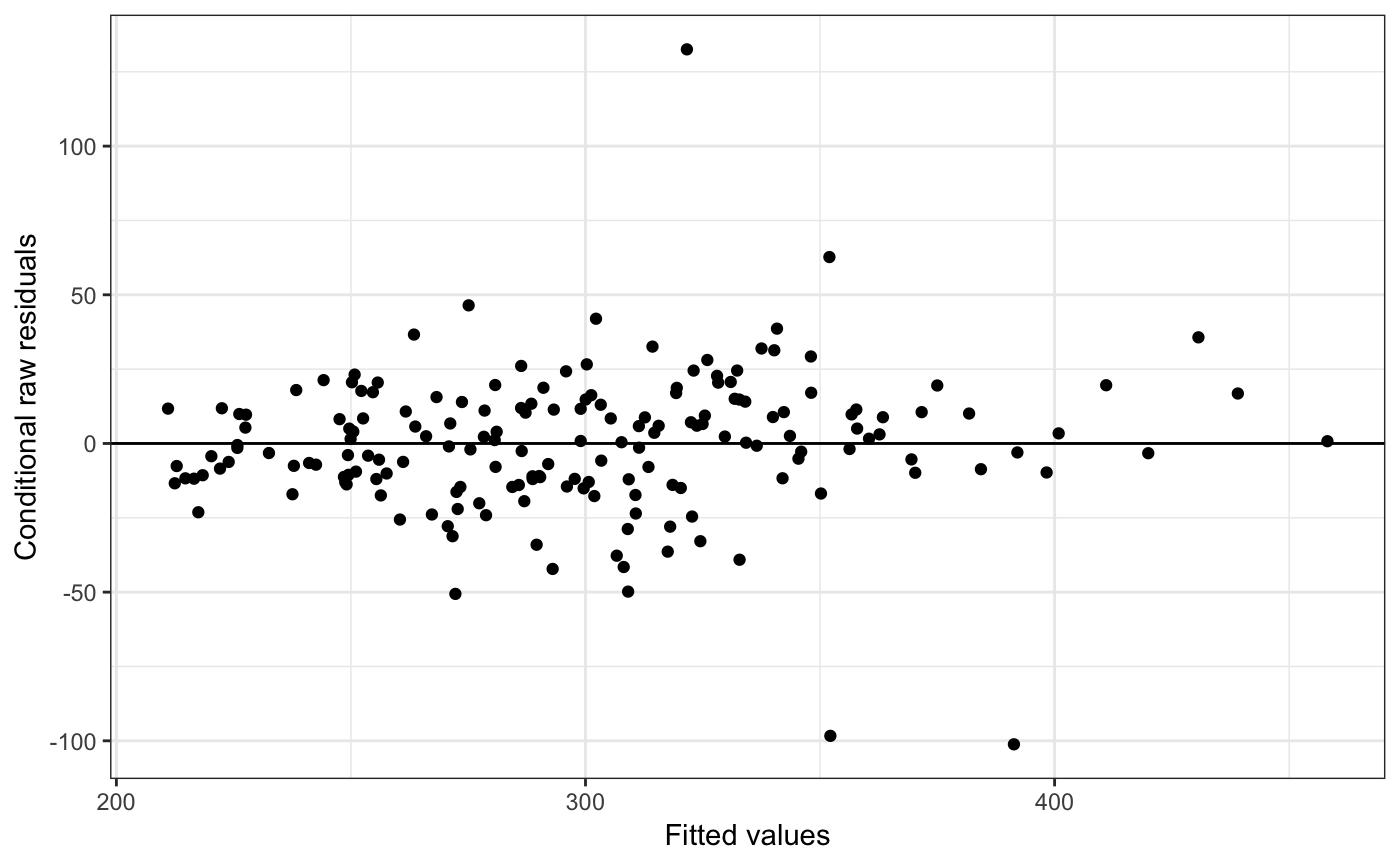
Creates a plot of residuals versus fitted values or model variable. This plot can be used to assess whether the assumptions of constant variance and linear form assumptions are adequate.
plot_redres(model, type = "raw_cond", xvar = NULL)
Arguments
| model | Model fit using |
|---|---|
| type | String identifying type of residual. Default is "raw_cond".
See |
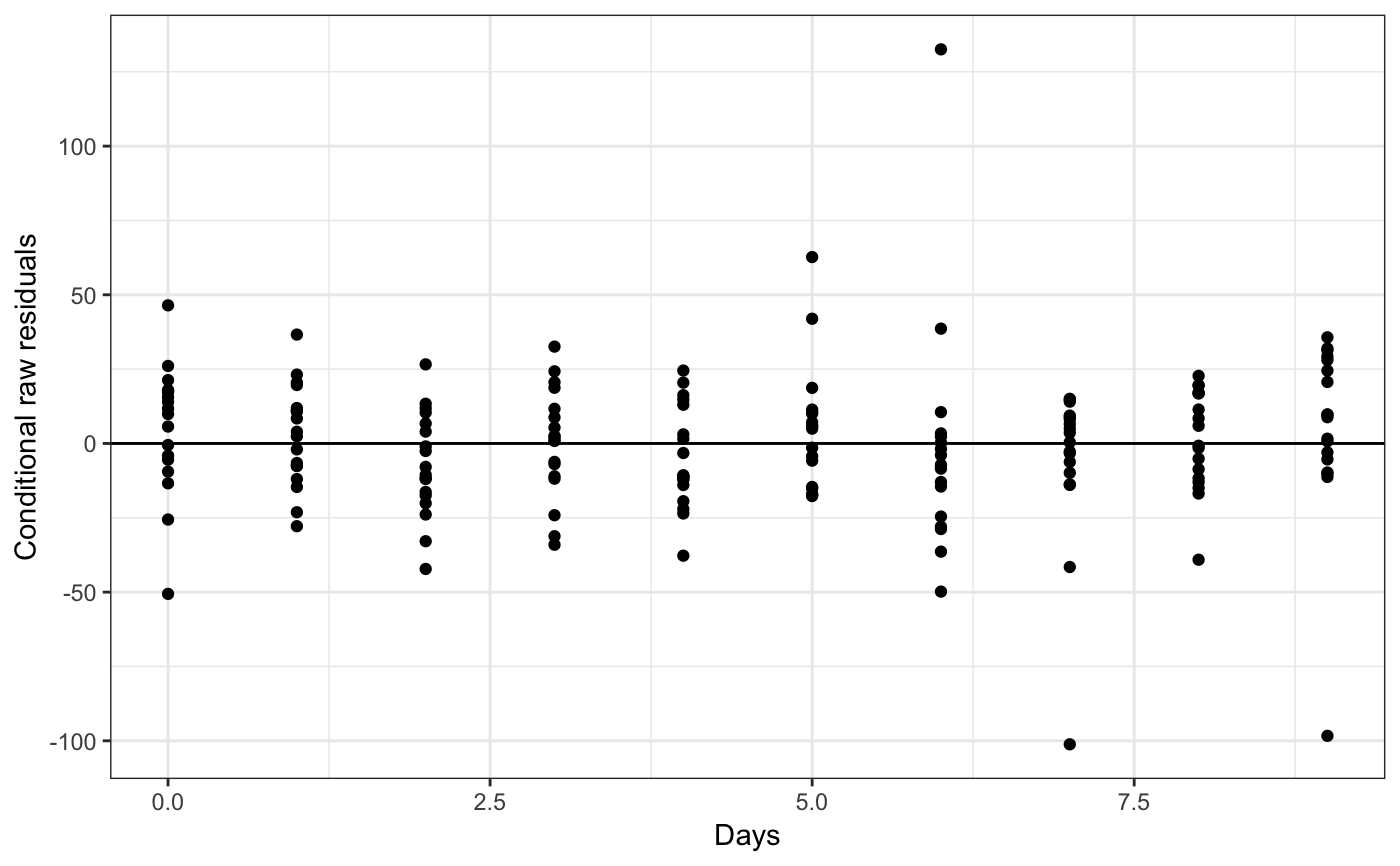
| xvar | String indicating the variable to be plotted on the x-axis. By default, the fitted values are plotted on the x-axis. Any variable used in the lmer model can be specified. |
Value
A residual plot in the form of a ggplot2 object.
Examples
# fits a linear mixed effects model library(lme4) fm1 <- lmer(Reaction ~ Days + (Days | Subject), sleepstudy) # plots raw conditional residuals by fitted values. plot_redres(fm1)# plots raw conditional residuals by selected variables `Days`. plot_redres(fm1, xvar = "Days")# plots standardized conditional residuals by fitted values. plot_redres(fm1, type = "std_cond")# edits theme of ggplot2 object library(ggplot2) plot_redres(fm1, type = "pearson_mar") + ggtitle("Pearson Marginal Residuals by Fitted Values")