
redres is an R package developed to help with diagnosing linear mixed models fit using the function lmer from the lme4 package. It is meant to supplement the lme4 package.

![]()
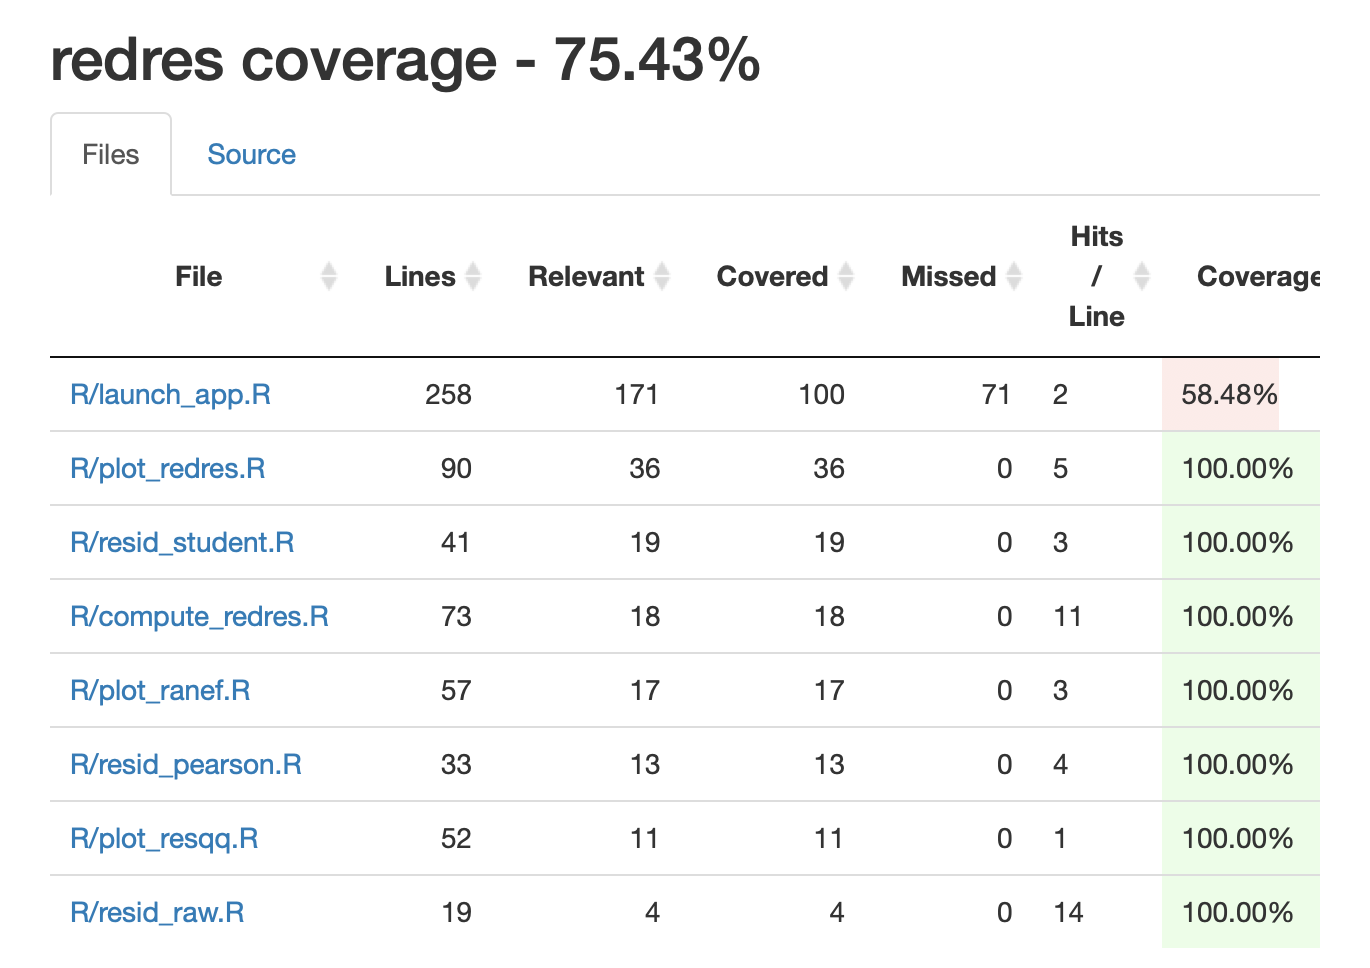
Note that the code coverage is less than 90% due to our function launch_app that runs the Shiny app. The other functions in the package all have 100% code coverage. See the image below of the coverage report (taken on May 6, 2019).
Installation
redres can be installed from the GitHub repository using the devtools package.
# Installs redres
devtools::install_github("goodekat/redres")
Once installed, the package can be loaded as usual.
# Loads the library
library(redres)
Functions
The package contains the following functions.
compute_redres
compute_redres computes residuals given an lmer model and a specified residual type. The available residual types are listed below.
-
"pearson_cond": Pearson conditional residuals -
"pearson_mar": Pearson marginal residuals -
"raw_cond": raw conditional residuals (default) -
"raw_mar": raw marginal residuals -
"std_cond": studentized conditional residuals -
"std_mar": studentized marginal residuals
# fits an lmer model
library(lme4)
m <- lmer(Reaction ~ Days + (Days | Subject), data = sleepstudy)

# computes the default residuals (raw conditional)
rc_resids <- compute_redres(m)

# computes the Pearson marginal residuals
pm_resids <- compute_redres(m, type = "pearson_mar")

# computes the studentized conditional residuals
sc_resids <- compute_redres(m, type = "std_cond")

# puts the residuals in a data frame with observed response and prints the first six rows
resids <- data.frame(sleepstudy$Reaction, rc_resids, pm_resids, sc_resids)
head(resids)
## sleepstudy.Reaction rc_resids pm_resids sc_resids
## 1 249.5600 -4.102638 -0.05183946 -0.1827204
## 2 258.7047 -14.624497 -0.08779115 -0.6273252
## 3 250.8006 -42.195157 -0.57418908 -1.7645439
## 4 321.4398 8.777483 0.97112562 0.3616111
## 5 356.8519 24.523024 1.48696343 1.0048545
## 6 414.6901 62.694664 2.39619943 2.5789296plot_redres
plot_redres creates a plot (using ggplot2) of the residuals versus the fitted values given a model and a specified residual type. All residual types listed for redres work with plot_redres.
# creates a plot of the conditional studentized residuals versus the fitted values
plot_redres(m, type = "std_cond")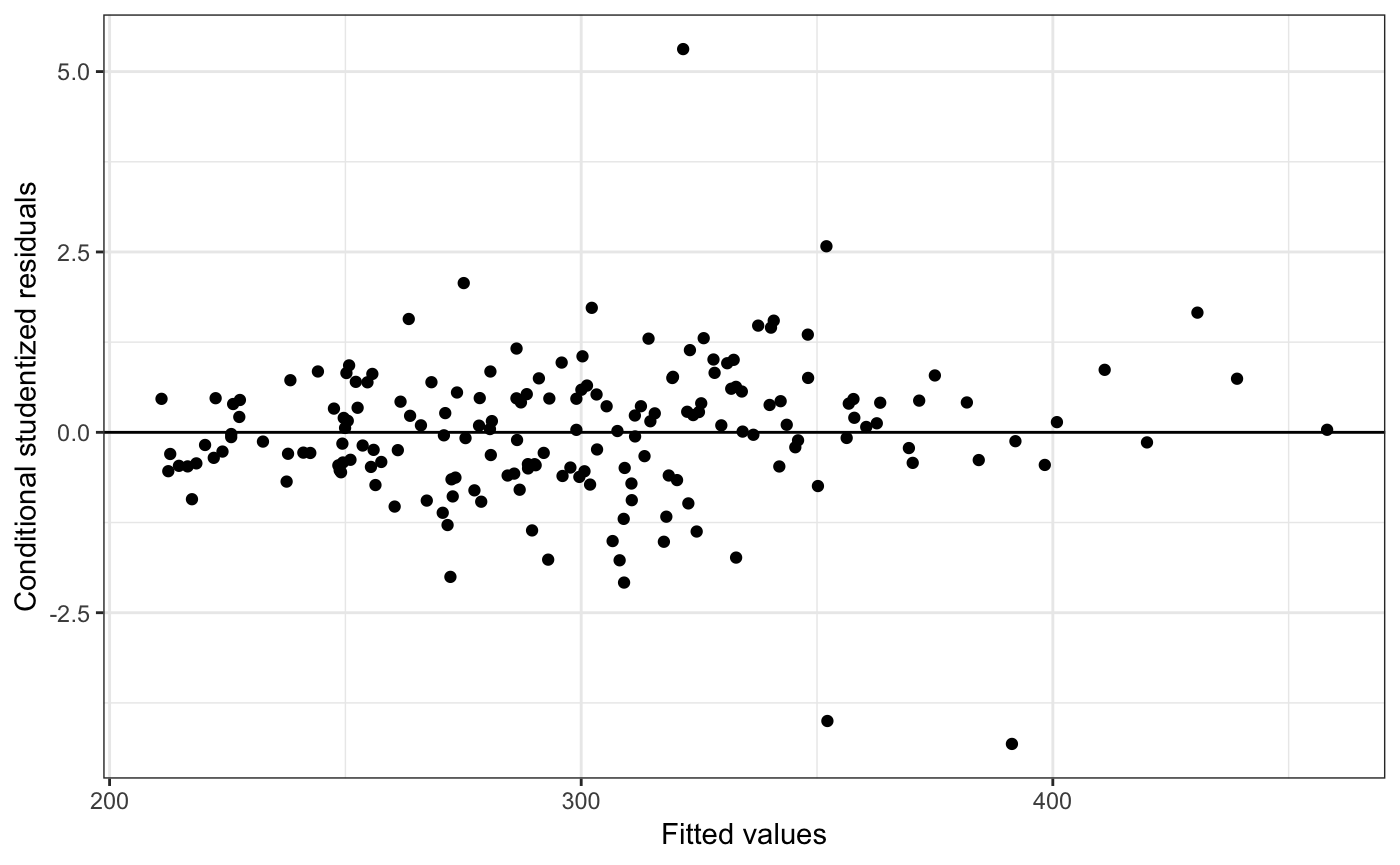
plot_resqq
plot_resqq creates a normal quantile plot (using ggplot2 and qqplotr) of the raw conditional residuals, raw_cond. By the assumptions of a model fit using lmer these residuals are expected to be normally distributed. Obvious departures indicate an invalid assumption. See vignette for more details about interpreting quantile plots.
# creates a residual quantile plot for the error term
plot_resqq(m)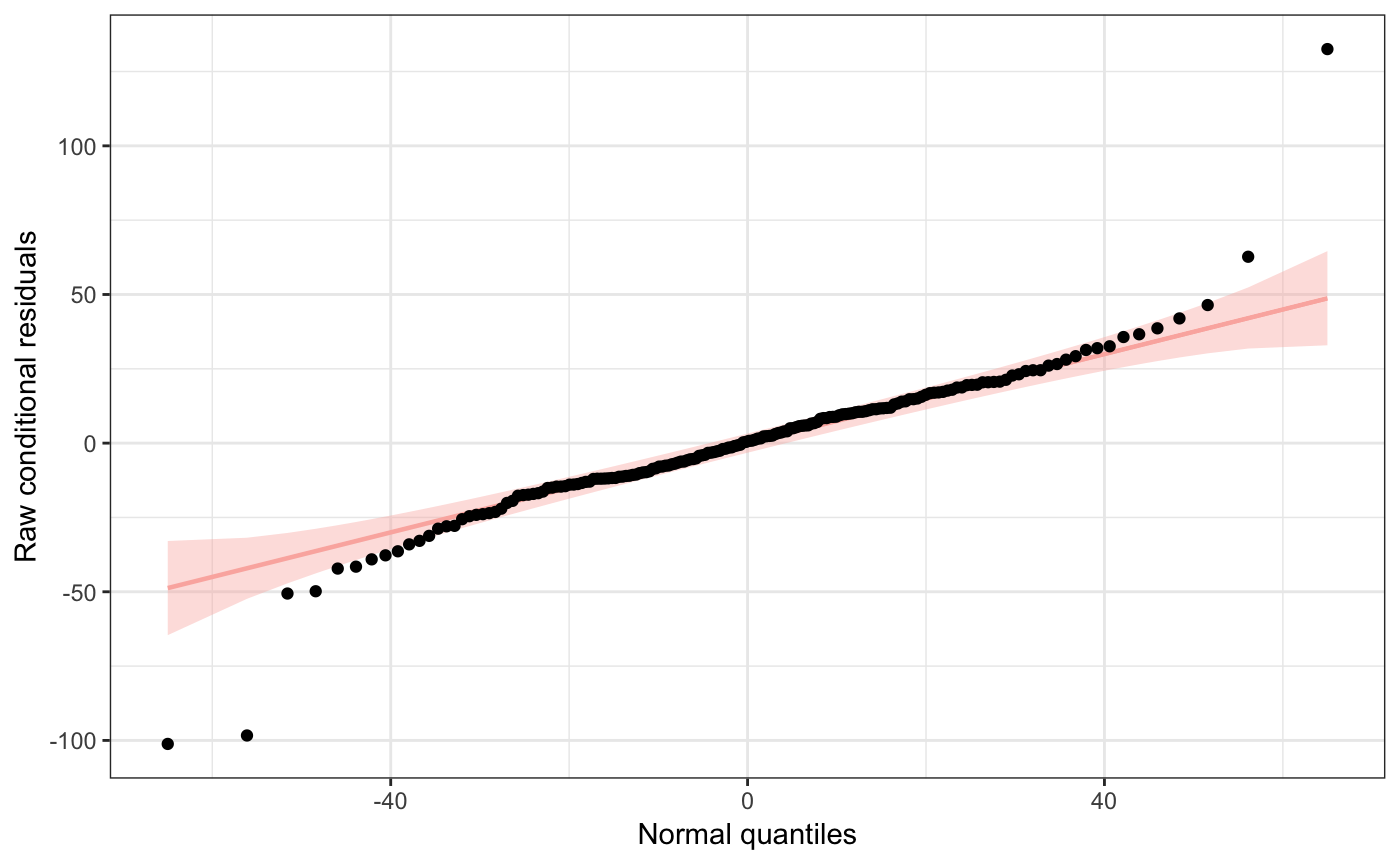
plot_ranef
plot_ranef creates normal quantile plots for all random effects in the model. Under the assumptions of a lmer model, each random effect term is normally distributed. This function will return a grid of plots fit using ggplot2 and qqplotr.
# creates normal quantile plots for each random effect
plot_ranef(m)
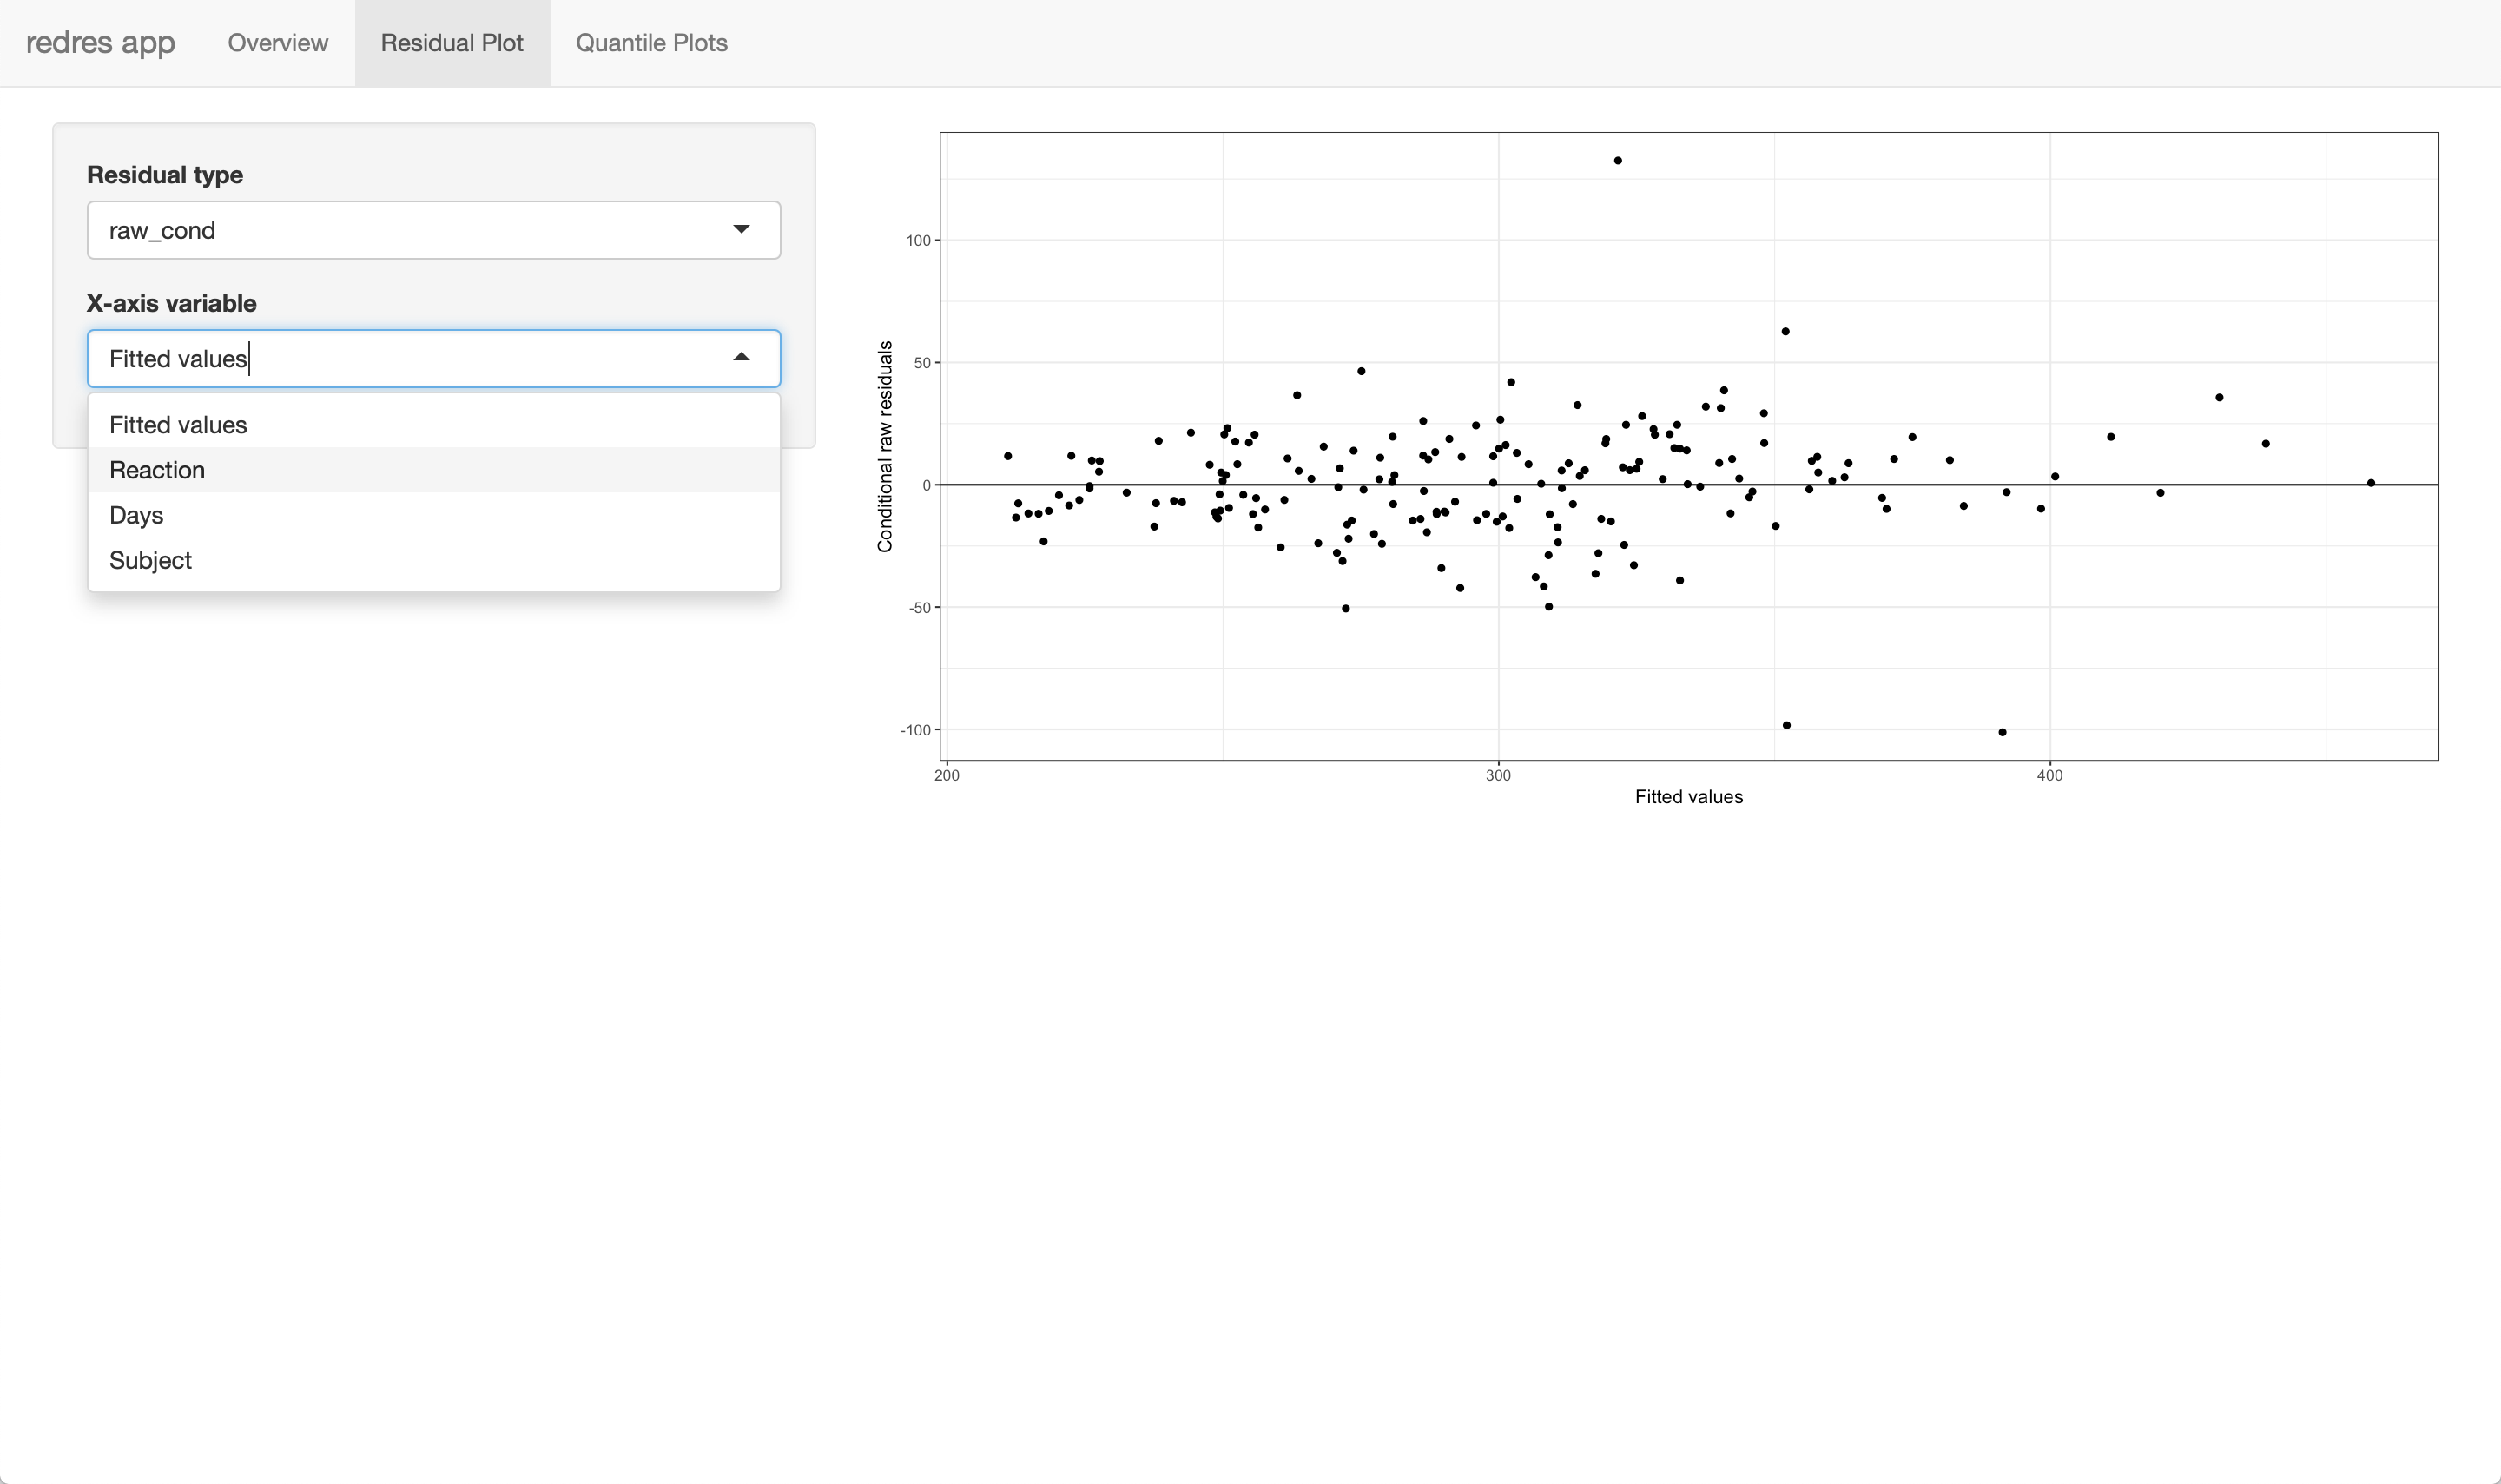
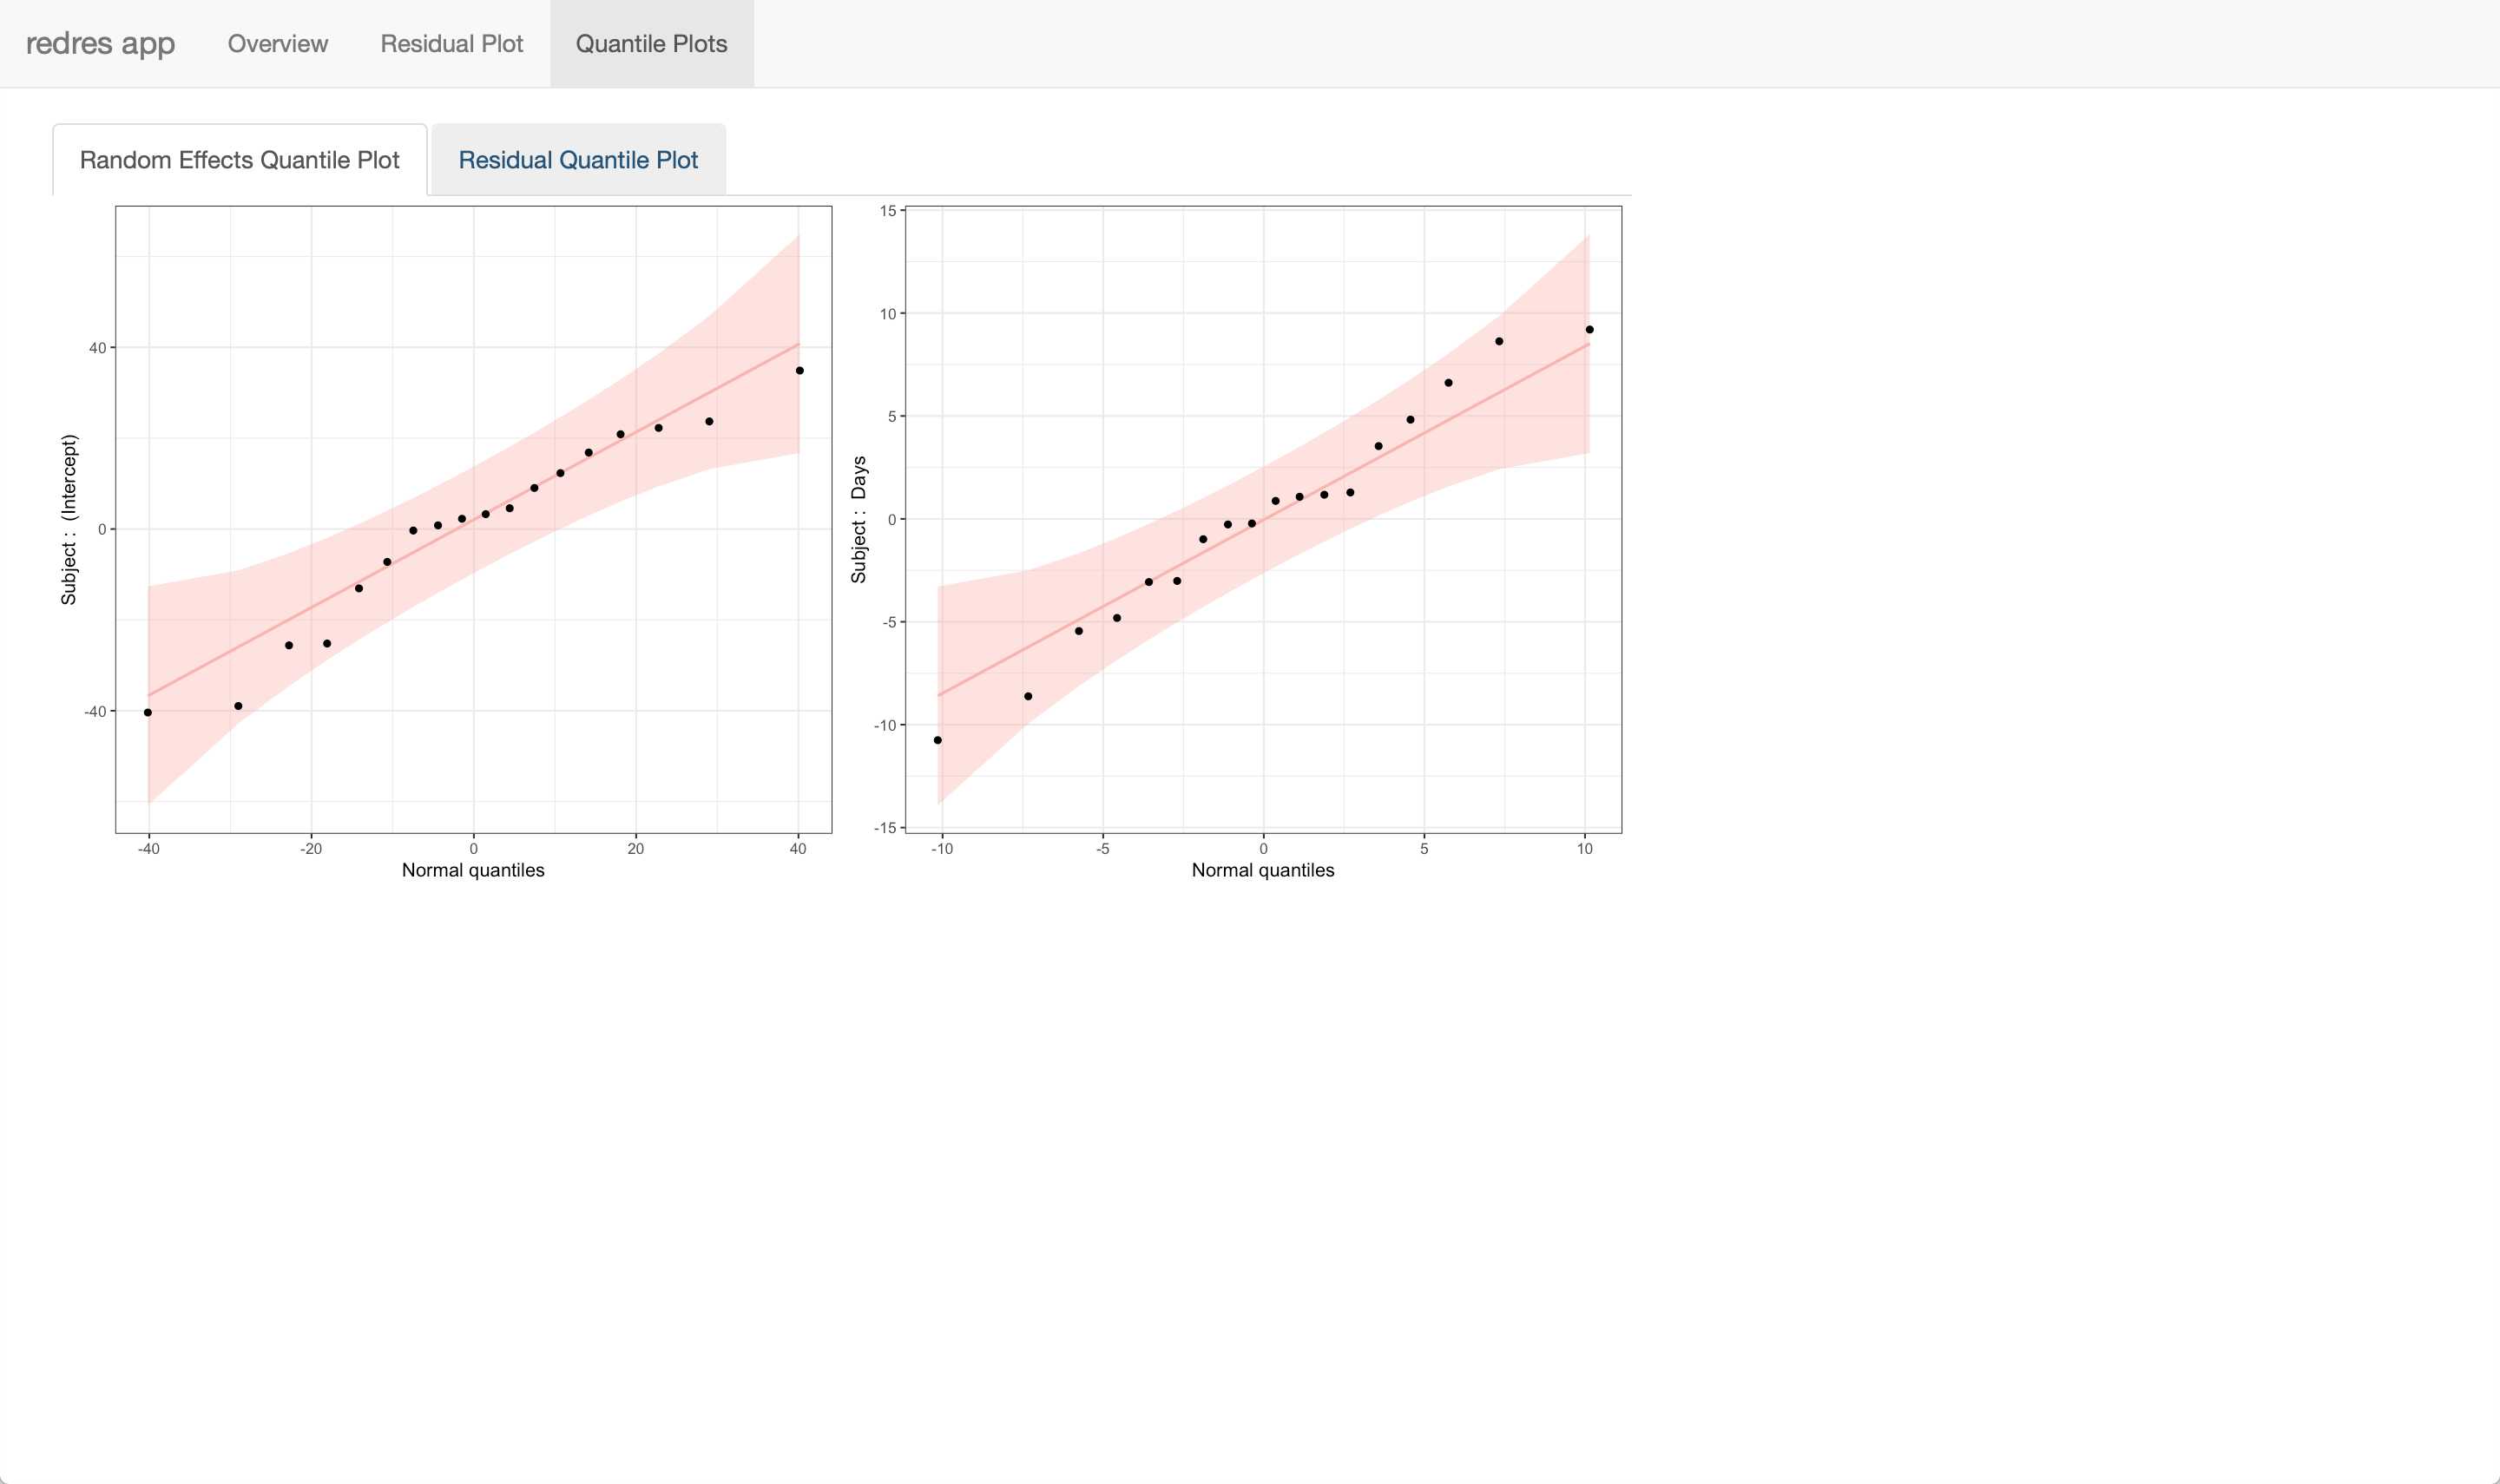
launch_redres
launch_redres opens a Shiny app that includes interactive panels to view the diagnostic plots from a model. The function can be used by inputting one or two models into the app in the form of a vector. If two models are input, the residual plots for each model will be shown side by side in the app. Screen shots of the app are shown below.
# opens the app
launch_redres(m)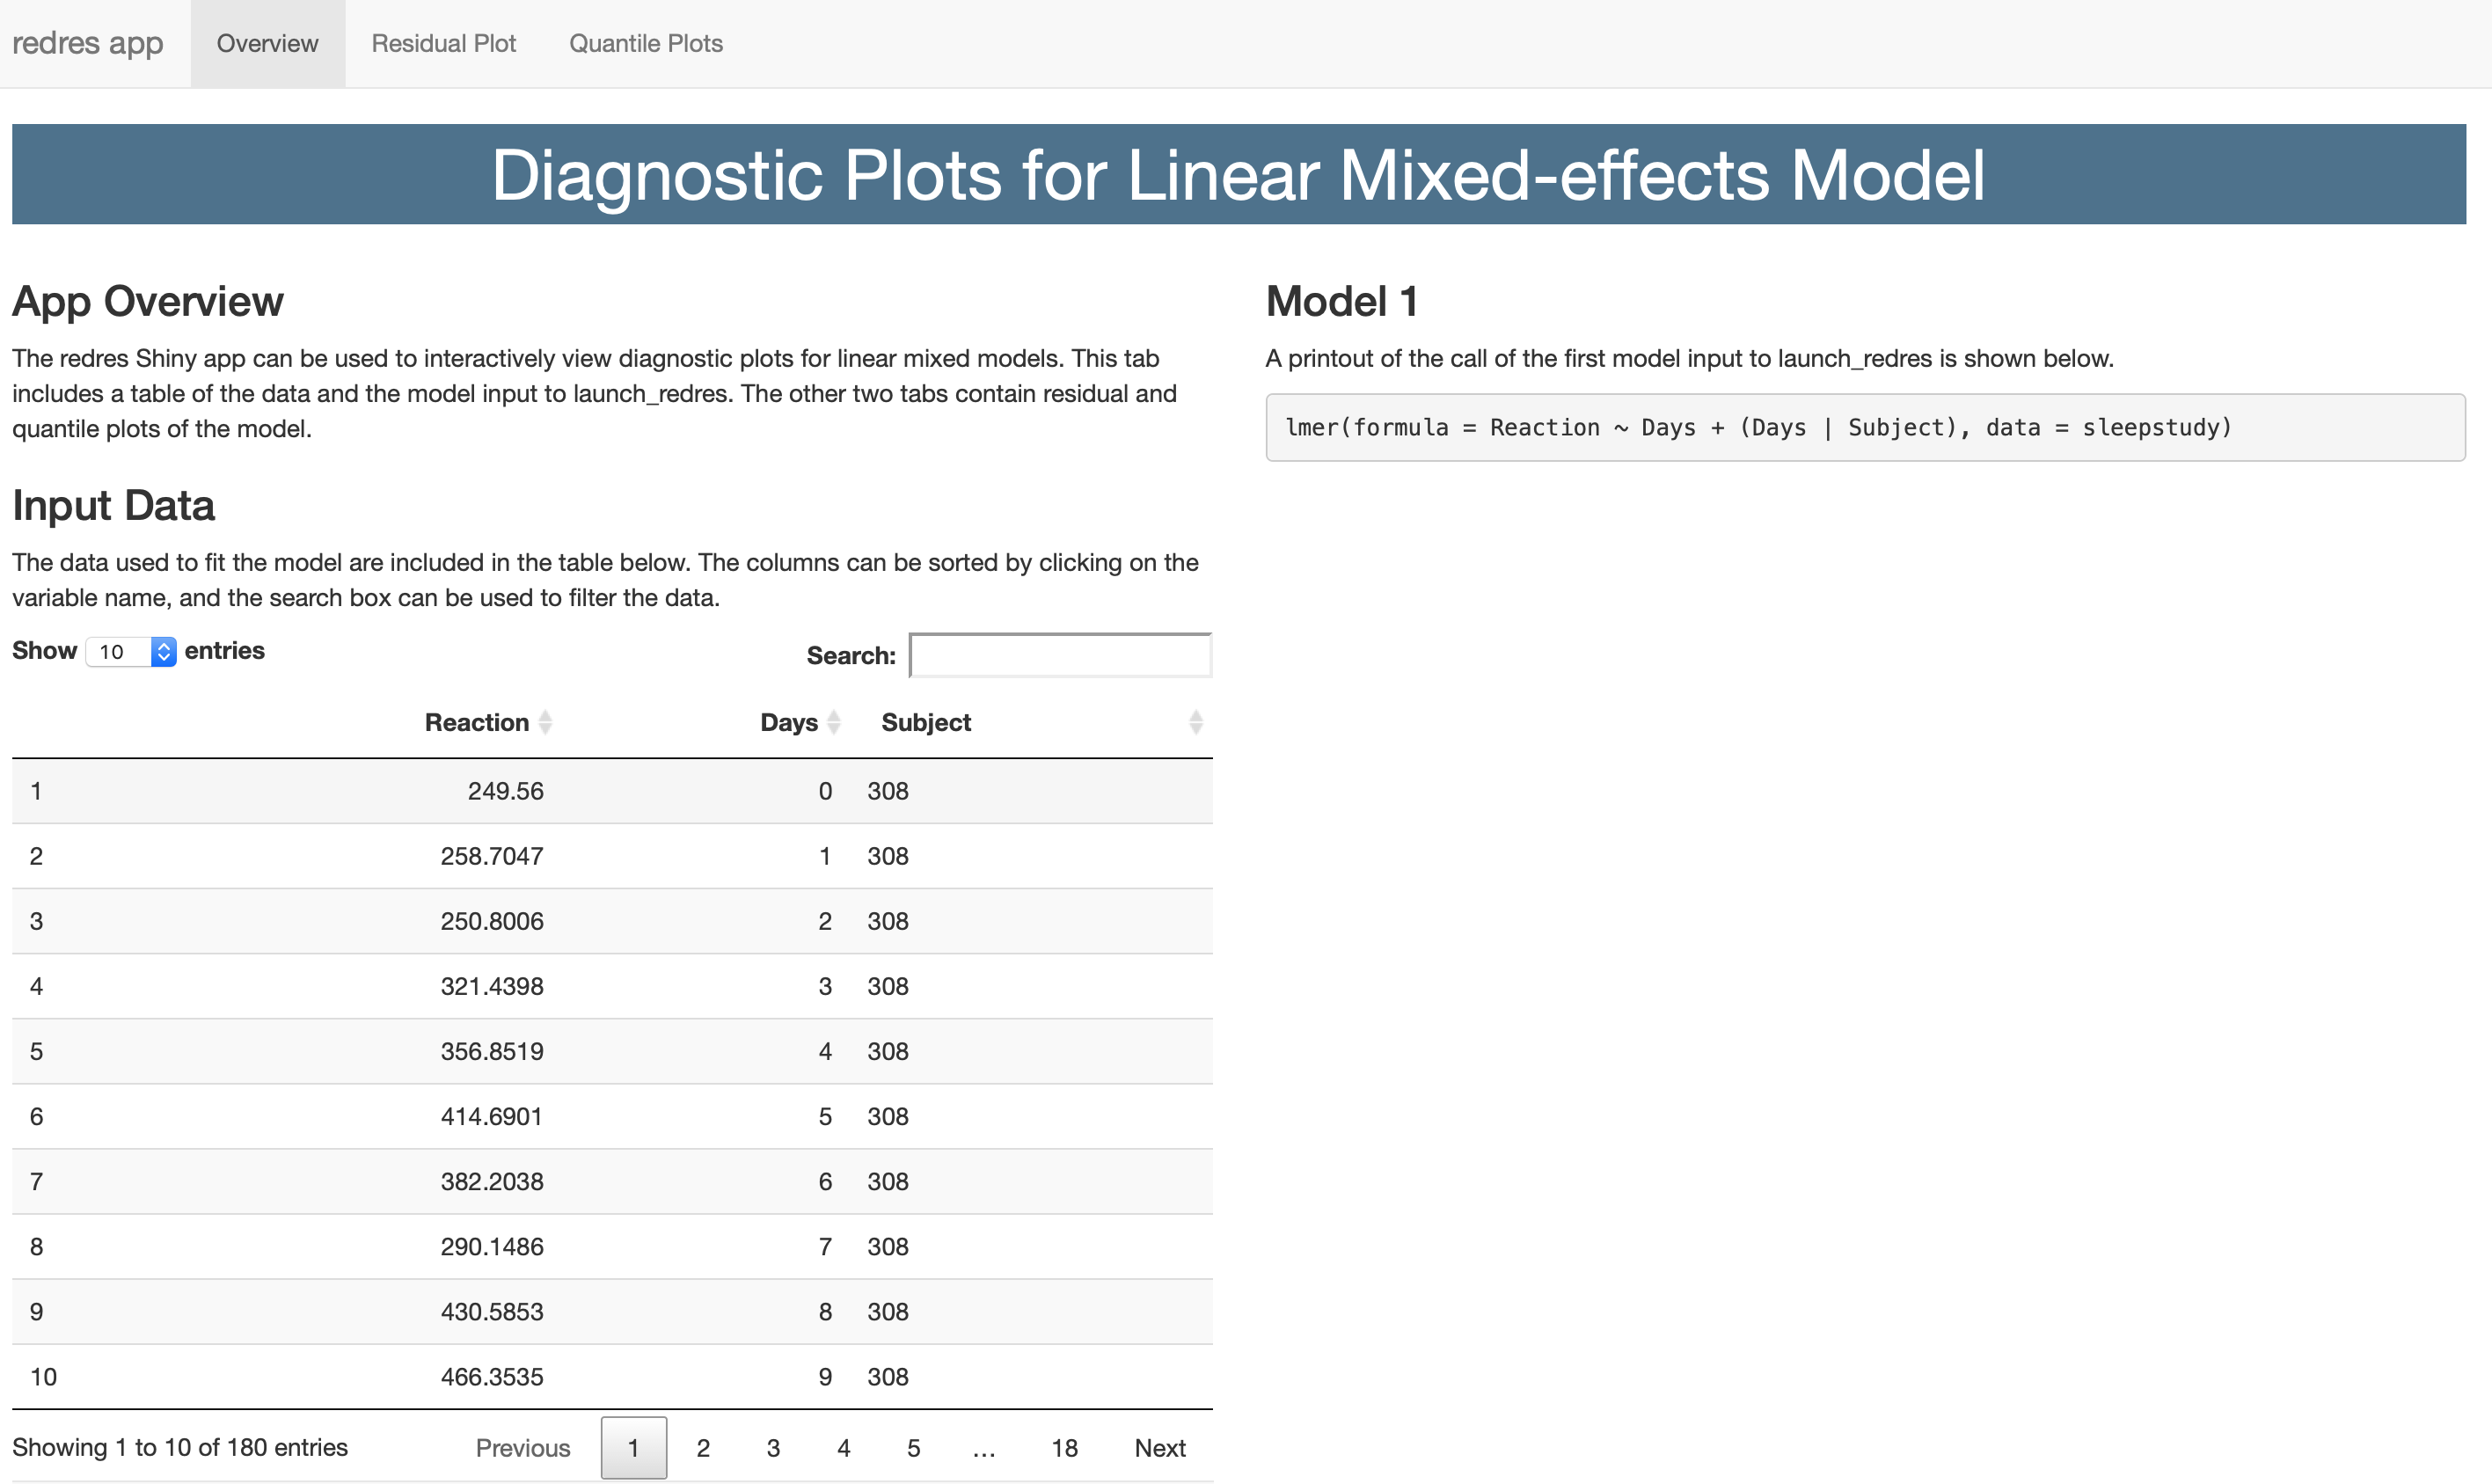
Learn More
To learn more about redres, read through the vignette for redres which contains:
- details on how the residuals are computed
- explanations of how to use the different residual types
- interpretations of the plots
- examples using
redresto assess the assumptions of a linear mixed model
Additionally, more information is available at the package website.