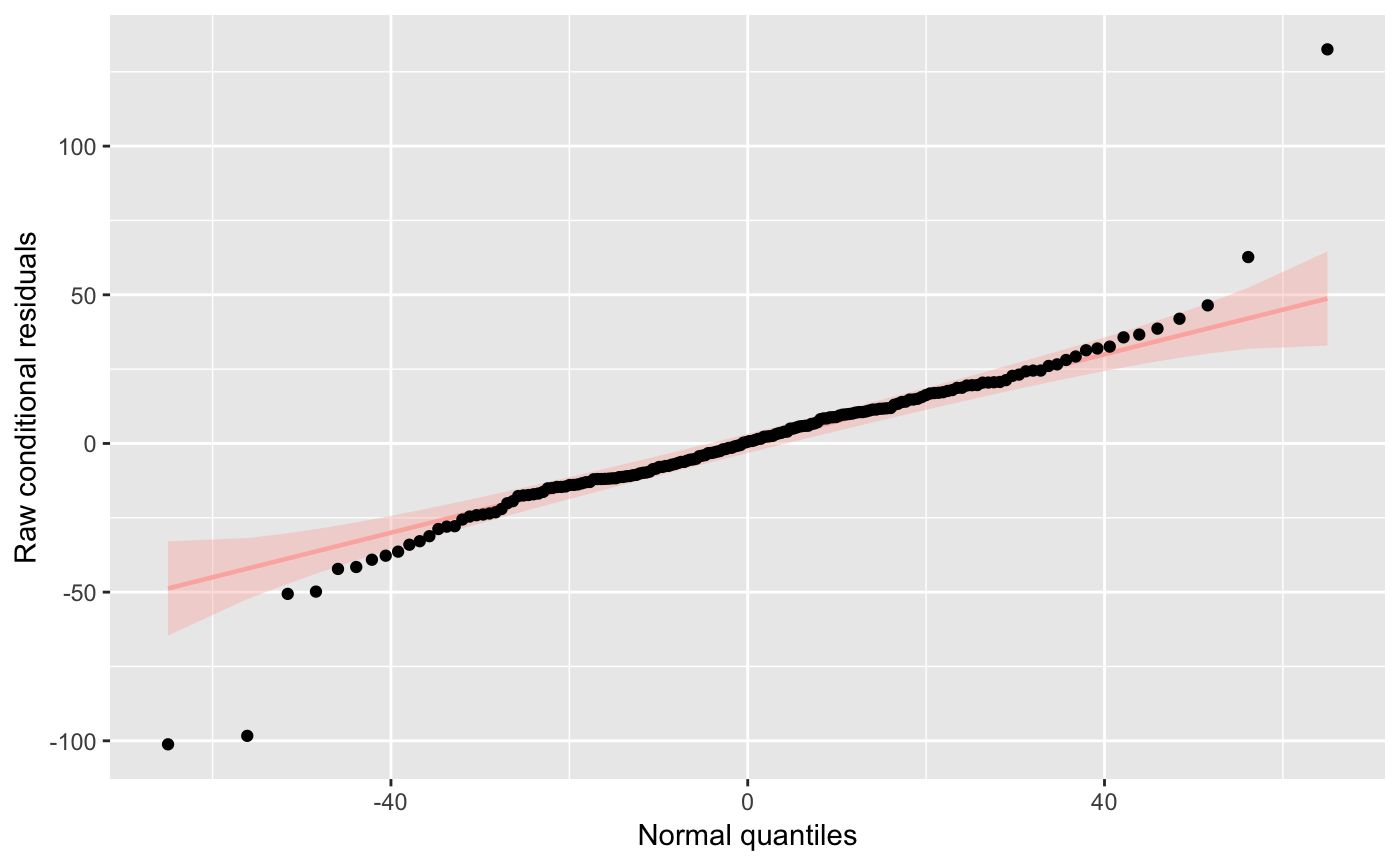
Creates a normal quantile plot of the raw conditional residuals. For linear mixed models, these residuals are expected to be normally distributed. This plot can be used to assess this assumption.
plot_resqq(model)
Arguments
| model | Model fit using |
|---|
Value
A normal quantile plot in the form of a ggplot2 object.
Details
Confidence bands are constructed pointwise 95% normal confidence intervals.
Examples
# fits a linear mixed effect model using lme4 where model has a # random intercept for Days and random slope for Subject*Days library(lme4) fm1 <- lmer(Reaction ~ Days + (Days | Subject), sleepstudy) # checks that error term is normally distributed plot_resqq(fm1)